
In today’s data-driven business world, success is not just about effort — it’s about measurable outcomes . That’s where Key Performance Indicators (KPIs) come into play. KPIs help organizations track progress, identify problems, and make smarter decisions based on actual performance data rather than assumptions.
This guide will explain what KPIs are, how to choose them, and provide real-world examples from every major department . You’ll also learn how to avoid common mistakes and set up an effective KPI tracking system.
1. What Is a Key Performance Indicator (KPI)?
A Key Performance Indicator (KPI) is a quantifiable measurement used to evaluate how well an organization, team, or individual is achieving key business objectives. KPIs are essential because they:
- Help align teams around shared goals
- Provide clarity and focus on what matters most
- Enable regular progress tracking and course correction
- Support decision-making with real-time data
- Improve accountability and performance at all levels
Difference Between KPIs, Metrics, and Objectives
It’s important to understand the difference between KPIs and other types of measurements:
| Term | Definition | Example |
| Objective | A specific goal you want to achieve | Increase website traffic by 20% in Q1 |
| Metric | Any numerical data point used to measure something | Monthly unique visitors |
| KPI | A metric that directly supports a strategic objective | Unique visitors from organic search increased by 15% |
Not all metrics are KPIs — but all KPIs are metrics.
2. Why KPIs Matter in Business
KPIs are not just for large corporations. They’re critical for businesses of all sizes. Here’s why:
Align Teams Around Goals
When everyone knows what they’re being measured against, it creates alignment and focus.
Example: A sales team with a KPI like “Increase monthly sales by 10%” will prioritize actions that directly contribute to this goal.
Track Progress Over Time
KPIs allow you to see whether your strategies are working and where adjustments are needed.
Example: If your customer service team has a KPI of “Resolve customer issues within 24 hours,” you can track how many tickets were resolved within that time frame each week.
Make Data-Driven Decisions
With clear KPIs, leaders can base their decisions on facts, not intuition.
Example: If your marketing KPI shows that one campaign has a much higher conversion rate than another, you can shift budget toward the better-performing campaign.
Improve Accountability
KPIs clarify who is responsible for what and how success is defined.
Example: An HR manager with a KPI like “Reduce employee turnover by 10%” will be held accountable for implementing retention strategies.
2. Types of KPIs
KPIs can be categorized based on the type of performance they measure and the timeframe in which they reflect results.
Leading vs. Lagging Indicators
| Type | Description | Purpose | Example |
| Leading Indicators | Predict future performance | Used for proactive planning | Number of sales leads generated |
| Lagging Indicators | Reflect past performance | Used for evaluating outcomes | Monthly revenue growth |
Think of leading indicators as “early warning signs” and lagging indicators as “post-mortems.”
Financial KPIs
Used to assess the financial health and profitability of a business.
| KPI | Description | Example |
| Gross Profit Margin | Measures profit after subtracting cost of goods sold | 45% |
| Net Profit Margin | Measures overall profitability after all expenses | 10% |
| Return on Investment (ROI) | Measures return relative to investment cost | 200% ROI on marketing spend |
| Cash Flow | Tracks money coming in and going out | $500,000 positive cash flow per month |
Operational KPIs
Measure efficiency and effectiveness of internal processes.
| KPI | Description | Example |
| Order Fulfillment Time | How long it takes to process and ship an order | 24 hours |
| Production Output | Number of units produced in a given period | 10,000 units per week |
| Customer Service Response Time | Average time to respond to customer inquiries | 2 hours |
Customer-related KPIs
Focus on customer satisfaction, loyalty, and retention.
| KPI | Description | Example |
| Customer Satisfaction Score (CSAT) | Measures customer happiness after a service interaction | 85% satisfaction |
| Net Promoter Score (NPS) | Measures likelihood of customers recommending your product | +40 |
| Churn Rate | Percentage of customers who stop using your product or service | 5% monthly churn |
Employee/HR KPIs
Track workforce performance and engagement.
| KPI | Description | Example |
| Employee Retention Rate | Percentage of employees who stay with the company | 90% retention |
| Time-to-Hire | Average time to fill an open position | 21 days |
| Training Hours Per Employee | Amount of training provided annually | 20 hours per year |
| Employee Engagement Score | Measures how engaged employees feel | 75% engagement |
4. How to Choose the Right KPIs
Choosing the right KPIs is crucial. Here are some best practices:
Align with Strategic Goals
Every KPI should support a specific business objective.
Example: If your goal is to increase brand awareness, a relevant KPI might be “Social media impressions.”
Keep It Measurable and Actionable
Avoid vague or unquantifiable KPIs.
Bad example: “Improve customer experience.”
Good example: “Increase customer satisfaction score by 10 points in 6 months.”
Avoid Overloading
Too many KPIs can lead to confusion and inefficiency.
Best practice: Focus on 3–5 KPIs per department or team.
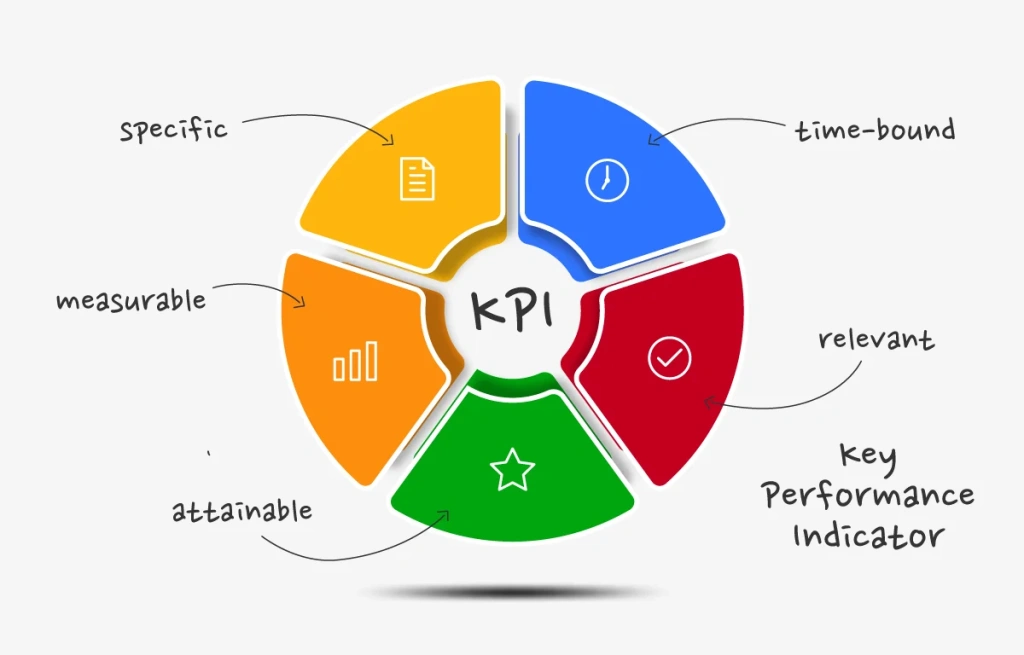
Use SMART Criteria
Ensure your KPIs are:
- S pecific
- M easurable
- A chievable
- R elevant
- T ime-bound
5. KPI Examples by Department
Here are detailed examples of KPIs for various departments and roles:
Marketing Department
| KPI | Description | Example |
| Cost Per Acquisition (CPA) | Cost to acquire one paying customer | $15 CPA for Google Ads |
| Click-Through Rate (CTR) | Percentage of people who click on an ad | 3.2% CTR |
| Conversion Rate | Percentage of website visitors who take a desired action | 5% conversion rate on landing page |
| Return on Ad Spend (ROAS) | Revenue generated per dollar spent on advertising | $4 ROAS on Facebook Ads |
| Brand Awareness Index | Measures how well your brand is recognized | Increased by 20% over Q2 |
Sales Department
| KPI | Description | Example |
| Lead Conversion Rate | Percentage of leads that become customers | 12% conversion rate |
| Average Deal Size | Average revenue per sale | $1,500 average deal size |
| Sales Growth | Percentage increase in sales over a period | 15% YoY sales growth |
| Win Rate | Percentage of deals won | 40% win rate |
| Sales Cycle Length | Average time to close a sale | 30 days |
HR Department
| KPI | Description | Example |
| Employee Retention Rate | Percentage of employees who stay | 88% retention rate |
| Time-to-Hire | Days to fill an open role | 21 days |
| Training Hours Per Employee | Annual training time per employee | 20 hours |
| Employee Engagement Score | Measures job satisfaction and motivation | 75% engagement score |
| Turnover Cost | Cost associated with replacing an employee | $10,000 per departure |
Finance Department
| KPI | Description | Example |
| Gross Profit Margin | Profit after COGS / Revenue | 45% margin |
| Net Profit Margin | Net profit / Revenue | 10% margin |
| EBITDA | Earnings before interest, taxes, depreciation, and amortization | $2M EBITDA |
| Working Capital | Current assets minus current liabilities | $500K working capital |
| Debt-to-Equity Ratio | Total debt / Shareholder equity | 0.8:1 ratio |
IT/Engineering Department
| KPI | Description | Example |
| System Uptime | Percentage of time systems are operational | 99.9% uptime |
| Bug Resolution Time | Average time to fix software bugs | 24 hours |
| Deployment Frequency | How often new features are deployed | 3 times per week |
| Mean Time to Recovery (MTTR) | Average time to recover from system failure | 4 hours |
Customer Service Department
| KPI | Description | Example |
| First Response Time | Time until first reply to a customer | 2 hours |
| Customer Satisfaction (CSAT) | Post-interaction satisfaction rating | 90% CSAT |
| Net Promoter Score (NPS) | Likelihood to recommend your service | NPS of +45 |
| Resolution Time | Time taken to fully resolve a ticket | 8 hours |
| Escalation Rate | Percentage of tickets escalated to senior staff | 5% escalation rate |
6. How to Measure and Track KPIs
Once you’ve selected your KPIs, you need a system to track them effectively.
Tools for Tracking KPIs
- Google Analytics : For website and digital marketing KPIs.
- Salesforce : For sales and CRM KPIs.
- Tableau / Power BI : For visual dashboards and data analysis.
- HR Software (e.g., Workday) : For HR KPIs like turnover and engagement.
- Financial Dashboards (e.g., QuickBooks, Xero) : For financial KPIs.
Best Practices for KPI Reporting
- Set review intervals (weekly, monthly, quarterly).
- Compare KPIs to benchmarks and historical data.
- Share results with stakeholders and team members.
- Adjust KPIs when business goals change.
7. Common Mistakes to Avoid When Using KPIs
Even experienced professionals can fall into these traps:
Setting Vague or Unmeasurable KPIs
Avoid KPIs like “Improve customer experience” without defining what that means.
Better: “Increase customer satisfaction score by 10 points in 6 months.”
Ignoring Context
Don’t interpret KPIs in isolation. Consider external factors like market trends or seasonality.
Focusing Only on Short-Term Gains
Long-term success requires balancing short-term and long-term KPIs.
Using Too Many KPIs
Prioritize the most impactful ones to avoid overwhelming your team.
Conclusion
Key Performance Indicators (KPIs) are the backbone of any successful business strategy. Whether you’re in marketing, sales, HR, finance, or operations, choosing the right KPIs and tracking them effectively can drive measurable results and sustainable growth.
By setting clear, measurable KPIs aligned with your business goals, you’ll be able to monitor progress, celebrate wins, and identify areas for improvement — all backed by data.